In today’s volatile markets, demand forecasting is no longer a support function—it’s a strategic differentiator. Organizations that align demand signals with real-world drivers like seasonality, competitor pricing, weather and promotions consistently outperform their peers in supply planning, inventory allocation and revenue management.
At Netision, we’ve found that forecasting accuracy improves not through better algorithms alone, but by integrating smarter factors. Below, we outline a four-stage framework that stitches together the key influencers of demand—so you can move from reactive forecasting to a truly proactive, data-driven strategy.
Strategic Forecasting Framework
| Stage | Objective |
|---|---|
| 1. Data Foundation | Build a clean, comprehensive historical dataset |
| 2. Signal Extraction | Engineer and map external & internal demand drivers |
| 3. Model Integration | Blend dynamic models with contextual inputs |
| 4. Decision Enablement | Turn forecasts into actionable business insights |
1. Data Foundation
Goal: Ensure your raw data is trustworthy before layering on complexity.
Key Actions:
- Unify sources: Sales, returns, cancellations, customer interactions.
- Normalize: Account for openings/closures, product life-cycles and stock-outs.
- Decompose: Separate base demand from event-driven spikes (e.g. launch peaks).
“Garbage in, garbage out.” Even the best model will flounder on messy data.
2. Signal Extraction
Goal: Transform raw variables into meaningful demand signals—when, why and where customers buy.
a. Seasonality & Calendar
- Decompose trends by week-of-year, month and major holidays.
- Align forecasts with festive peaks, long weekends and school breaks.
b. Competitor Pricing
- Monitor real-time competitor prices and elasticity zones.
- Run scenario “what-ifs” (e.g. our price ±10% vs. theirs).
c. Promotions & Discounts
- Isolate promotional uplift with control groups.
- Model fatigue and cannibalization across SKUs.
- Tag campaigns by type (Flash Sale, BOGO, Loyalty).
d. Weather & Events
- Align demand to temperature swings, rainstorms or pollen counts.
- Ingest live API feeds for weather, local festivals or even cricket finals.
e. Macroeconomics & Sentiment
- Track GDP, inflation, unemployment, consumer confidence.
- Monitor social buzz and media sentiment around key categories.
3. Model Integration
Goal: Leverage a hybrid of models—each tuned to your unique signal mix.
| Model Type | Strength | Best Use Case |
|---|---|---|
| Time Series | Seasonality & holiday effects | Stable SKUs, predictable cycles |
| Machine Learning | Nonlinear, high-volume patterns | Promo-heavy or price-sensitive SKUs |
| Deep Learning | Long-term dependencies, complex signals | Sentiment-linked or event-driven demand |
| Ensemble | Combines multiple perspectives | When no single model dominates |
Pro tip: Weight each feature by its importance—some drivers may explain 60% of variance, others <5%.
4. Decision Enablement
Goal: Embed forecasts into execution—so insights drive action.
Tactical Workflows
- Replenishment: Store-level safety stock & reorder.
- Staffing: Align workforce schedules to demand peaks.
- Pricing Triggers: Automatic repricing when thresholds hit.
Strategic Workflows
- Launch Planning: Synchronize product roll-outs with forecast peaks.
- Production Scheduling: Optimize batch runs and lead times.
- Expansion Readiness: Identify regions primed for new stores or SKUs.
Visualization Layer
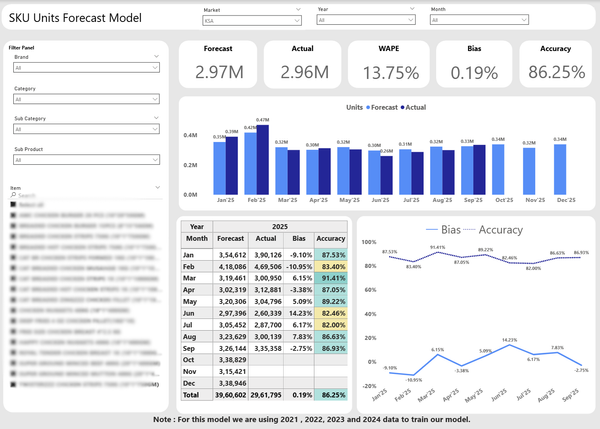
Use Power BI, Looker or Tableau to build executive dashboards with:
- Forecast Accuracy: MAPE, Bias and Trend metrics
- Gap Alerts: Automate “demand vs. supply” thresholds
- Scenario Planning: “What-if” slicers for pricing, promotion and weather
Summary: Think in Layers, Act in Loops
| Layer | Strategic Question |
|---|---|
| Historical Data | What was our base, unfiltered demand? |
| External Signals | Which market or environmental factors drive it? |
| Internal Levers | How do pricing, promos and availability play in? |
| Predictive Model | What will happen under baseline and alternate scenarios? |
| Decision Layer | What actions should we take now, and how do we prepare for risks? |
Forecasting isn’t a one-off—it’s a continuous loop. By layering data, signals, models and decisions, you transform demand forecasting into your strategic operating system—powering finance, supply chain, marketing and growth.
Ready to elevate your forecasting? Netision Experts are here to help you.