In today’s data-driven world, business intelligence tools are essential for organizations to make informed decisions quickly. Power BI, Microsoft’s powerful business analytics tool, is revolutionizing the way companies analyze and visualize their data. By leveraging Power BI’s advanced features, businesses can not only gain insights from their data but also make data-driven decisions that drive growth and efficiency.In this post, we’ll explore ten advanced Power BI use cases that can transform your decision-making processes, from what-if scenarios to predictive analytics and beyond. Let’s dive into how you can maximize Power BI’s potential to enhance your decision-making capabilities.
What-If Scenarios
Business Function: Finance, Marketing, Operations
Power BI allows businesses to model various scenarios and understand the impact of different variables on business outcomes. With What-If Parameters, users can explore potential outcomes by adjusting values dynamically.
A finance team can use Power BI to forecast different financial outcomes based on varying interest rates or product pricing strategies.
This enables decision-makers to explore multiple possibilities and make informed decisions based on different potential scenarios.
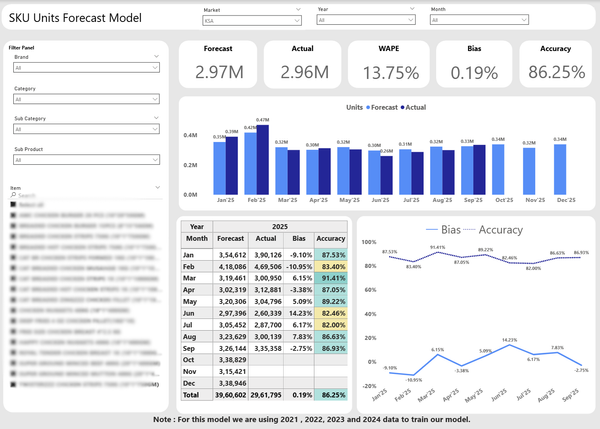
Predictive Analytics with Power BI
Business Function: Sales, Marketing, Product Development
Power BI’s integration with Azure Machine Learning or R allows users to perform predictive analytics. You can predict future trends, customer behavior, or sales performance.
A retail business uses predictive models in Power BI to forecast inventory needs based on predicted sales trends, reducing stockouts by 25%.
Using predictive analytics enables businesses to prepare for future demands, improving resource allocation and customer satisfaction.
Advanced Data Visualizations
Business Function: Executives, Operations, Marketing
Power BI offers a wide range of visualizations to present data in meaningful ways. Advanced charts like waterfall charts, funnel charts, and decomposition trees help users visualize complex data relationships.
A marketing team uses a decomposition tree to break down campaign performance across various segments, allowing for deeper insights into the drivers of success.
Better visualizations lead to more effective communication of insights, making data easier to understand and act upon.
KPI Dashboards for Real-Time Monitoring
Business Function: Executive Management, Operations
Power BI’s KPI dashboards offer real-time monitoring of key performance indicators (KPIs). Decision-makers can track metrics like sales revenue, customer satisfaction, or production efficiency with up-to-date data.
A manufacturing company tracks production line performance in real-time, instantly identifying bottlenecks that can be addressed before they affect delivery times.
Real-time insights ensure timely action and enhance operational efficiency, reducing downtime and improving overall performance.
Drill-Through and Drill-Down Features
Business Function: Operations, Sales, Finance
Drill-through and drill-down features in Power BI allow users to explore data at different levels of detail. Drill-through lets users jump from high-level KPIs to detailed reports, while drill-down enables users to see more granular data on specific visuals.
A sales team can drill down into a regional sales report to see specific sales by store location, then drill through to view individual sales transactions.
These features make data exploration more interactive, helping decision-makers gain deeper insights without needing to sift through multiple reports.
Data Alerts and Notifications
Business Function: Operations, Sales, Customer Support
Power BI allows users to set up data alerts to get notified when specific thresholds are met. This can be particularly useful for tracking KPIs, inventory levels, or financial targets.
A customer support manager receives an alert when customer satisfaction scores drop below a specific threshold, enabling them to investigate and address the issue quickly.
Automated alerts improve responsiveness and ensure that important changes are immediately noticed and acted upon.
Data Consolidation from Multiple Sources
Business Function: Finance, Marketing, IT
Power BI can seamlessly consolidate data from multiple sources, including cloud services, databases, and Excel files, into a single view. This helps businesses get a comprehensive understanding of their operations across various systems.
A marketing team consolidates data from Google Analytics, social media platforms, and sales data into one Power BI dashboard to get a unified view of campaign performance.
Data consolidation eliminates silos and ensures that decision-makers have a single source of truth, improving accuracy and collaboration.
Integration with Artificial Intelligence (AI)
Business Function: Marketing, Sales, Finance
Power BI integrates with AI-powered tools, such as Azure Cognitive Services, to provide text analytics, image recognition, and machine learning models directly within reports.
A customer service team uses Power BI’s AI integration to analyze customer feedback and sentiment analysis, helping them prioritize issues based on customer sentiment.
AI integration enables smarter decision-making by providing deeper insights from unstructured data, such as customer feedback or social media posts.
Time Intelligence for Trend Analysis
Business Function: Finance, Marketing, HR
Power BI’s time intelligence features allow businesses to analyze trends over time. By using time-based functions, you can compare current performance to historical data and track progress toward goals.
A finance team uses time intelligence to compare quarterly revenue against previous years, identifying trends and areas for growth.
Time intelligence gives businesses the ability to spot long-term trends, optimize planning, and forecast future outcomes.
Geo-Spatial Analysis
Business Function: Sales, Marketing, Logistics
Power BI supports geo-spatial analysis, allowing businesses to visualize their data on maps. This can be used for market segmentation, location-based sales analysis, and even logistics optimization.
A logistics company uses Power BI’s geo-spatial features to optimize delivery routes and identify underperforming sales regions.
Geo-spatial analysis enhances decision-making by providing insights based on location and spatial relationships, improving resource allocation and performance.
Conclusion
By leveraging these advanced Power BI use cases, businesses can unlock the full potential of their data, improve decision-making, and enhance their overall performance. Whether it’s through predictive analytics, what-if scenarios, or real-time monitoring, Power BI empowers organizations to make smarter, data-driven decisions that propel growth and profitability.
Ready to maximize the potential of Power BI for your business? Reach out to Netision to learn how we can help you harness the power of business intelligence and take your decision-making to the next level.